Methods
Route 82’s quality of service can be broken down into two parts: (1) the scheduled frequency of service and (2) the actual reliability of service. Standards and definitions vary by agency and are located in the Appendix. Here, the term “frequency” will refer to the scheduled frequency of bus service. Route 82 data was collected from CTA schedules and Global Transit Feed Specification (GTFS) data published by the CTA. For other agencies, frequency standards are from various Title VI reports and service standard publications. Reliability metrics are derived from official agency reports, interactive dashboards, and publications. There is no third party data used in this report. The term reliability refers to the actual service delivered, measured by a variety of metrics listed in the Appendix. Using these metrics, the authors determined that just 9 percent of CTA bus routes are in compliance with agency reliability standards.46
Results
Service Frequency Standards
The service standards for scheduled frequency of service per route provide important context for Route 82 and overall system service. The CTA designates select routes with more “stringent frequency standards” as Key Routes, while all other routes will be referred to as non-key routes.47 The designation system for Key Routes is described in the Appendix. Key Route bus service has a much higher headway standard than non-key route bus service, as demonstrated by Table 4.
| CTA Schedule Standards | Weekday Peak | Weekday Midday | Weekday Evening | Sa/Su Afternoon |
|---|---|---|---|---|
| Key Route headways (minutes) | 10 | 15 | 20 | 15 |
| Non-key route headways (minutes) | 30 | 30 | 30 | 30 |
| Figure R1, Source: Chicago Transit Authority, “Service Standards and Policies,” May 2023, https://www.transitchicago.com/assets/1/6/Chicago_Transit_Authority_Service_Standards.pdf. | ||||
Route 82 is a Key Route, meaning its frequency service standards are much higher than non-key routes. Non-key Routes, which make up about 65 percent of the system’s total routes, have a service standard of 30-minute headways, even during peak service hours.
Route 82 Frequency of Service in North Lawndale
Using GTFS data, the project team calculated average headways for Route 82 at specific stops in North Lawndale. For example, Table 5 shows average headways for Route 82 at the 15th and Central Park stop.
| Route 82 Scheduled Frequency | Weekday Peak | Weekday Midday | Weekday Evening | Saturday Afternoon | Sunday Afternoon |
|---|---|---|---|---|---|
| Time (minutes) | 10 | 10 | 16 | 12.5 | 14 |
| Table R2, CTA GTFS data imported into ArcGIS Pro and analyzed for service frequency by stop and by day. Source: Chicago Transit Authority, “CTA GTFS Repository,” transitchicago.com, 2024, https://www.transitchicago.com/downloads/sch_data/. | |||||
According to CTA data, Route 82 meets frequency of service standards for all time periods and has more frequent scheduled service for certain time slots than the standard. However, bus service does not always operate as scheduled.
Reliability Standards
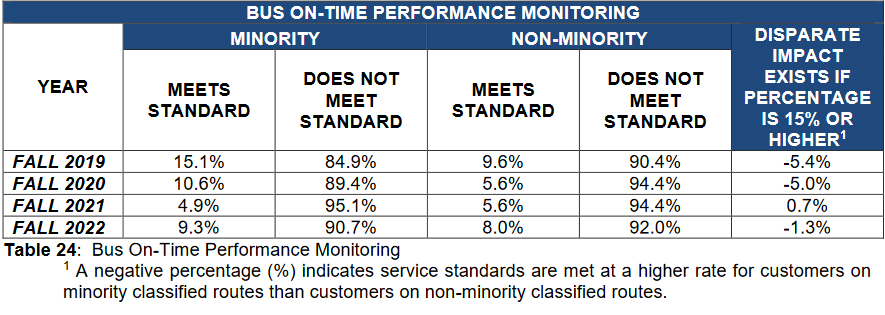
Although reliability has various measures, the CTA only offers one standard for reliability of service: Route Compliance Standard. This standard determines whether a route’s reliability is considered compliant for the purposes of Title VI equity analysis. Table 6 is an example of the Title VI equity analysis reported by CTA in 2022.

Per the Title VI report, CTA determines that a route is compliant with the agency’s on-time performance standards if “65 percent of trips on a given bus route are on-time.”48 In other words, up to 35 percent of bus trips on a route can arrive either more than one minute early or five minutes late and the route can still be considered compliant. There is no public, published data available on whether the Route 82 bus is considered compliant with the 65 percent reliability threshold.
Actual Reliability
According to On-Time Performance (Table 6), CTA definitions for minority and non-minority routes, and spatial analysis at the census tract level, 9 percent of routes citywide are compliant with the CTA’s own 65 percent threshold.49 CTA does provide a statistic to demonstrate “the percent of customers boarding on-time service systemwide,” which in 2022 was 54 percent.50
Aside from statistics which the CTA details in the Title VI Triennial Report, CTA also releases different, more detailed statistics on the CTA Performance Dashboard. The relevant statistics for the purposes of this report include additional wait time on average per passenger, per route, and optionally per stop, the percentage of buses which have “big gaps” between them, and the percentage of buses which are bunched. Table 7 details these statistics.
| September 2024 | CTA Overall | Route 82 | Difference |
|---|---|---|---|
| Bunched Intervals (percent) | 3.9 | 6.7 | 71.4 |
| Big Gaps Intervals (percent) | 5.0 | 7.3 | 46.9 |
| Figure R4, Source: Chicago Transit Authority, “CTA Performance Metrics & Reports,” transitchicago.com, September 2024, https://www.transitchicago.com/performance/. | |||
As demonstrated by Table 7, Route 82 in September 2024 performed worse than the CTA bus system overall for both metrics. This resulted in a 71.4 percent increase in bunched intervals compared to the system overall, and a 46 percent increase in big gaps intervals compared to the system overall. September 2024 was picked because it represents the most recent data, but the full dataset available on the dashboard (September 2023-2024) shows a similar picture, suggesting this trend is not isolated to one month (Table 8).
| CTA Overall | Route 82 | Difference | |
|---|---|---|---|
| Bunched Intervals (percent) | 2.8 | 4.7 | 67.8 |
| Big Gaps Intervals (percent) | 4.4 | 6.3 | 43.1 |
| Figure R5, Source: Chicago Transit Authority, “CTA Performance Metrics & Reports,” transitchicago.com, September 2024, https://www.transitchicago.com/performance/. | |||
The final statistic collected shows the excess wait time that an average passenger endures. This data can be disaggregated to a specific “time point” on a route. Table 9 represents the overall excess wait time for the month of September 2024 compared to Route 82’s overall excess wait time, in addition to Route 82’s excess wait time at the Central Park and Cermak Stop (chosen because it is in proximity to North Lawndale).
| CTA Overall | Route 82 Overall | Percent difference from CTA Overall | Route 82 at Central Park/Cermak | Percent difference from CTA Overall | Bus Excess Wait Time (minutes) |
|---|---|---|---|---|---|
| 1.93 | 2.41 | 24.8 | 2.39 | 23.8 | |
| Table R6, Source: Chicago Transit Authority, “CTA Performance Metrics & Reports,” transitchicago.com, September 2024, https://www.transitchicago.com/performance/. | |||||
As demonstrated by the table above (Table 9), Route 82 has a higher average wait time endured by passengers than the system overall, yet another statistic demonstrating that the bus is underperforming. This average wait time can be further disaggregated by direction, and the results of this disaggregation demonstrate another interesting trend, shown in Table 10.
| Northbound | Southbound | Percent difference | |
|---|---|---|---|
| Bus Average Excess Wait Time (minutes) | 1.16 | 3.65 | 214.6 |
| Source: Chicago Transit Authority, “CTA Performance Metrics & Reports,” transitchicago.com, September 2024, https://www.transitchicago.com/performance/. | |||
Southbound excess wait times at the Route 82 Central Park/Cermak stop are on average 214 percent higher than Northbound wait times, which is not surprising considering the stop is near the southern terminus, but this statistic combined with the previous statistics indicate a potential bunching issue. The graph below (Figure 14) visualizes Table 10 disaggregated by day.
Ultimately, while Route 82 scheduled service frequency meets CTA Key Route standards, it falls behind in reliability metrics compared to the system as a whole. This low reliability results in longer excess wait time for passengers. As demonstrated later in this report, the discomfort of this excess wait can be amplified by lack of shelter, lack of seating, or lack of safety from vehicles.
CTA in the Context of Peer Agencies
The Regional Transportation Authority designates nine peer regions for inter-agency comparison in its Regional Peer Review.51 Unfortunately, the peer review does not compare Chicago’s transportation system to that of peer regions in the context of frequency or reliability. The next section attempts to answer the question: How is CTA performing in relation to other agencies in peer regions, and what does this reflect about Route 82’s service in North Lawndale? Researching this question raised concerns about the lack of standardization of metrics, accessible data, and equity analyses across transit agencies.
Frequency Standards
Most peer agencies provide frequency standards. The first issue which arose was standardization; agencies had different definitions for peak and off-peak services, and some agencies, including CTA, divided off-peak into specific days and times of the week. The authors consolidated agency definitions into binary peak and off-peak categories. Peak and off-peak definitions per agency are located in the Appendix. Table 11 details peak and off-peak service standards per agency.
| Peak Headways (minutes) | Off-peak Headways (minutes) | |
|---|---|---|
| CTA | 30 | 30 |
| CTA Key Routes (82 included)s |
10 | 10 |
| MARTA (Atlanta) | 45 | 75 |
| MBTA (Boston) | 30 | 60 |
| DART (Dallas) | 30 | 60 |
| LCMTA | 30 | 60 |
| MDT (Miami) | 60 | 60 |
| MTA (New York) | 30 | 60 |
| SEPTA (Philadelphia) | 20 | 30 |
| WMATA (Washington, D.C. | 15 | 15 |
| Figure R9, Source: CTA, MARTA, MBTA, DART, LACMTA, MDT, MTA, SEPTA, WMATA. | ||
Reliability Analysis
Figure 15 shows bus on-time percentage per agency.54
As demonstrated by Figure 15 above, CTA is far behind its peers in reliability, as most agencies are within a range of 70-80 percent. CTA’s on-time performance for the most recently available year (2022) was 54 percent. This low metric does not demonstrate the potential depths of this metric for a route like Route 82. Bus-bunching and wait time metrics suggest that Route 82 would have an even lower reliability percentage than the overall system, potentially pushing the Route 82 below 50 percent, meaning the bus would be on time as often as it was late.
The CTA also has lower standards than peer agencies for route on-time performance compliance, which is the metric used in its Title VI Triennial Report. Of the peer agencies that publicly provide data on on-time performance by route type, CTA has the lowest standard that a route needs to be considered compliant: 65 percent. This means that if 65 percent of passenger trips on a route are on-time, the route is considered compliant. Table 12 compares this to peer agencies with available data.
| Route Compliance Standard (percent) | Routes in compliance (percent) | |
|---|---|---|
| CTA (Chicago) | 65 | 9 |
| MBTA (Boston) | 75 | 34.8 |
| LACMTA (Los Angeles) | 80 | 9.3 |
| Figure R11, Source: CTA, MBTA, LACMTA | ||
Of the three agencies with easily accessible published data, CTA has the lowest standard for a route to be considered compliant with on-time performance standards. Even with the lowest compliance standard, CTA still had the lowest compliance rate at 9 percent. Ultimately, while CTA has very good standards for service frequency, it falls far behind its peer agencies in delivering that standard of service, and thus has a lower reliability.
Continue Reading: Bus Stop Audit
